|
|
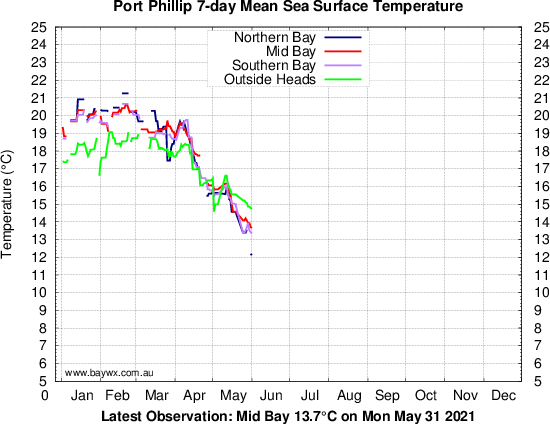
CSIRO Map | Integrated Marine Observing System | Group High Resolution Sea Surface Temperature Old Data: 2000 Graph | 2001 | 2002 | 2003 | 2004 | 2005 | 2006 | 2007 | 2008 | 2009 | 2010 | 2011 | 2012 Multi-year Comparison:Bay/Ocean/W.Port | Location Map | Navy Ocean maps Sydney Temp Graph | Wave Buoy Temps | Sandy Point Temp Graph North Point = Latitude: -37.9, Longitude: 144.9 | Mid Point = Latitude: -38.1, Longitude : 144.9 South Point = Latitude: -38.3, Longitude : 144.9 | Outside Bay = Latitude: -38.6, Longitude : 144.8
Citation: |
)
)
)
)


|
| home | contact | |
|
Disclaimer:
Whilst all care is taken, users are advised to check the original source of all data before use. This page was originally hosted by the The University of Melbourne School of Earth Sciences. It uses publicly available weather data from the Bureau of Meteorology, marine data from CSIRO Marine and Atmopsheric Research and tide data from the the Royal Yacht Club of Victoria |