|
|
South Channel | Point Wilson | Frankston Beach | Wilsons Prom
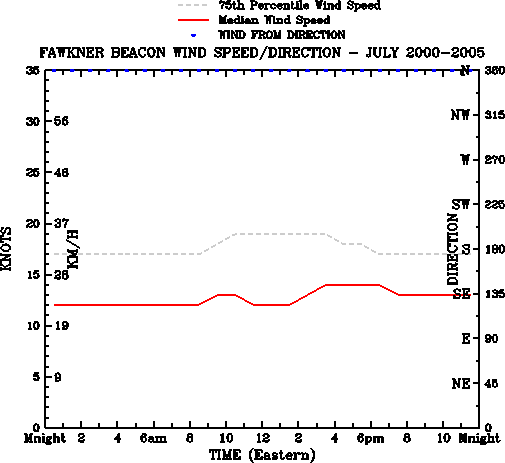
NB: Calculations are based upon 5-minute averages. Wind gusts will be up to 40% stronger. Data is from 2000-2005 (6 Years) The above graph shows the median wind speed (the speed at which half of the time the wind speed is faster, and half the time the speed is slower) in red, and the 75th Percentile wind speed (the wind speed that may be expected 1 in every 4 days) in grey. The most common wind direction is plotted with blue dots. Commentary:
|
| | home | old page | contact | |
| Disclaimer: This page, its content and style, are the responsibility of the author and do not represent the views, policies or opinions of the The University of Melbourne. Whilst all care is taken, users are advised to check the original source of all data before use. |
